Templates for scRNA-Seq analyses
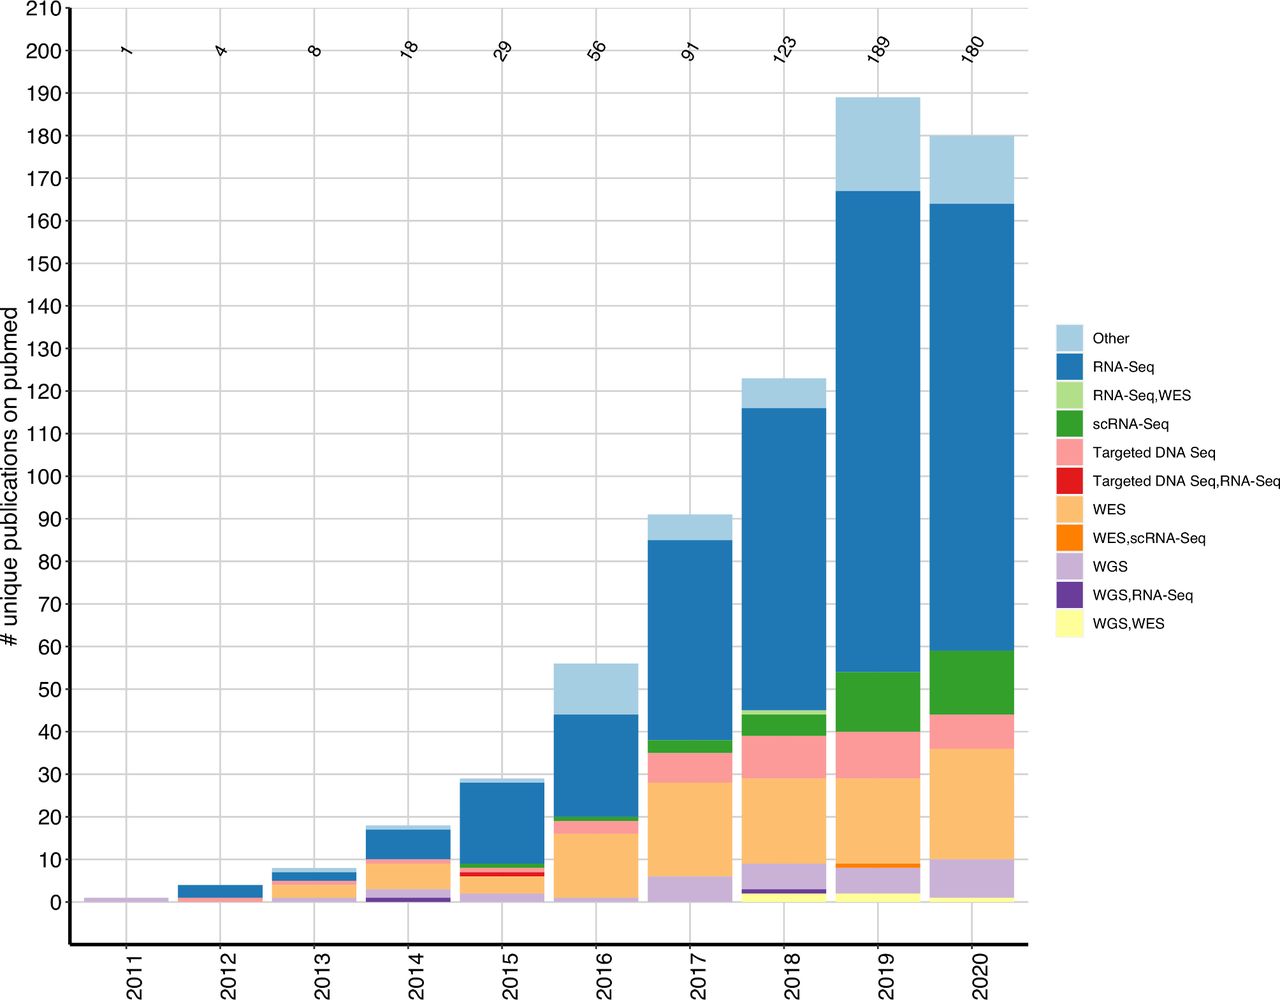
Single-cell sequencing has evolutionized the biomedical research for years. More applications are developed each year as well as novel analyzing methods. Sometimes it is not easy to trace all the developments and trends.
 (source)
This post aims to collect the good resources for single cell analysis scripts and templates, rather than tutorials or publications. This is useful to get an insight how other researchers actually do these analyses.
Seurat in R:
- https://github.com/ktrns/scrnaseq
- https://github.com/CostaLab/scrna_seurat_pipeline
- https://github.com/zhanghao-njmu/SCP
- https://github.com/kpatel427/YouTubeTutorials/tree/main
- https://github.com/brandonyph/Seurat_Integration_Introduction
Scanpy in Python:
- https://www.kaggle.com/code/babumiaphd/tutorial-single-cell-rna-seq-analysis-using-scanpy/notebook
- https://github.com/mousepixels/sanbomics_scripts/tree/main
Here is a summary of a typical workflow:
- Data Preparation
- Read data: Obtain raw sequencing data from single-cell RNA-seq experiments. This step involves importing sequencing files into the analysis environment.
- Read and print mapping statistics: Perform alignment of sequencing reads to a reference genome or transcriptome. This step provides insights into the efficiency and accuracy of the alignment process.
- Read gene annotation: Obtain information about gene features, such as gene IDs, gene names, and genomic coordinates. This information is essential for downstream analysis and interpretation.
- Read scRNA-seq data: Load and preprocess single-cell RNA-seq data into a suitable data structure for downstream analysis. This step involves converting raw sequencing reads into gene expression counts for individual cells.
- Pre-processing
- Quality control: Identify and filter out low-quality cells and genes. This step ensures data integrity and reliability for downstream analyses.
- Genes with highest expression: Explore gene expression distributions and identify highly expressed genes. This step provides insights into the most abundant transcripts in the dataset.
- Filtering: Apply additional filtering steps to remove unwanted cells or genes, such as mitochondrial genes or ambient RNA. This step improves the signal-to-noise ratio in the data.
- Quality control post filtering: Perform quality control assessments on the filtered dataset to ensure data integrity and reliability.
- Normalization
- Normalization: Normalize gene expression values to account for differences in sequencing depth and cell-specific biases. This step ensures that gene expression values are comparable across cells and samples.
- Combining multiple samples: Merge and integrate data from multiple samples or experiments to enable comparative analysis. This step addresses batch effects and technical variability across samples.
- Dimensionality Reduction
- Relative log expression: Transform normalized gene expression values into relative log expression or log-fold changes for each gene. This step facilitates dimensionality reduction and downstream analyses.
- Dimensionality reduction: Reduce the high-dimensional gene expression space into a lower-dimensional representation. This step enables visualization and exploration of complex datasets.
- Cluster Analysis
- Clustering: Identify groups of cells with similar gene expression profiles using clustering algorithms. This step reveals underlying cell populations and heterogeneity.
- Visualisation with UMAP: Visualize high-dimensional single-cell data in two or three dimensions using Uniform Manifold Approximation and Projection (UMAP). This step enables visualization and interpretation of complex cell populations.
- Distribution of samples in clusters: Assess the distribution of samples across cell clusters to understand sample composition and heterogeneity.
- Cell Cycle Effect: Correct for cell cycle effects in gene expression data to minimize confounding factors.
- Cluster QC: Perform quality control checks on cell clusters to evaluate cluster robustness and biological relevance.
- Marker Identification
- Known marker genes: Identify known marker genes associated with specific cell types or states. This step validates cell cluster identities based on expression patterns of marker genes.
- Marker genes: Identify marker genes that are differentially expressed between cell clusters. This step characterizes cell identities and states.
- Table of top marker genes: Generate a table summarizing the top marker genes for each cell cluster. This step provides insights into marker gene expression patterns.
- Visualisation of top marker genes: Visualize expression patterns of top marker genes across cell clusters using heatmaps or violin plots. This step highlights differences in gene expression between cell types or states.
- Differential Expression Analysis
- Heatmaps: Generate heatmaps to visualize gene expression patterns across cells and clusters. This step facilitates the identification of gene modules or expression signatures associated with specific biological processes or cell types.
- Functional enrichment analysis: Perform gene ontology (GO) or pathway enrichment analysis to elucidate biological functions associated with differentially expressed genes. This step identifies enriched biological processes, molecular functions, and cellular components within cell clusters.
- Differentially expressed genes: Identify genes that are differentially expressed between cell clusters or conditions. This step prioritizes biologically relevant genes based on statistical significance and fold changes.
- Output
- Export to Loupe Cell Browser: Export processed single-cell RNA-seq data and analysis results for visualization and exploration in the Loupe Cell Browser.
- Export to cellxgene browser: Export processed single-cell RNA-seq data and analysis results for visualization and exploration in the cellxgene browser.
- Export to Cerebro browser: Export processed single-cell RNA-seq data and analysis results for visualization and exploration in the Cerebro browser.
- Other output files: Generate additional output files as needed for further analysis and interpretation. These may include tables, plots, or summary statistics.
This post is licensed under CC BY 4.0 by the author.